

WiFi Analytics for Better Network Performance
A wireless complaint rarely arrives with useful technical detail. Users report that video calls freeze, applications feel slow, or a conference room has “bad Wi-Fi.” WiFi analytics gives network teams the evidence behind those reports by connecting client behavior, RF conditions, access point health, and application performance into an actionable operational view.
For organizations operating busy offices, healthcare facilities, campuses, warehouses, and multi-site environments, that visibility changes the conversation. Rather than reacting by adding access points or increasing transmit power, teams can identify whether the actual constraint is coverage, capacity, interference, roaming, DHCP, DNS, authentication, or the wired network supporting the WLAN.
What WiFi Analytics Should Tell You
WiFi analytics is the process of collecting, correlating, and interpreting wireless network data to understand performance and guide decisions. It goes beyond a dashboard that shows whether an access point is online. A useful analytics program explains how users experience the network, where performance degrades, why it happens, and what corrective action is most likely to produce a measurable result.
The distinction matters because availability is not performance. An access point can be reachable from a controller while clients connected to it experience retries, high latency, poor roaming, or a congested channel. Likewise, strong signal strength alone does not prove a healthy wireless experience. A client may have excellent RSSI but suffer from low signal-to-noise ratio, excessive contention, or a weak upstream connection.
Effective analysis brings several data sources together. Wireless controllers and cloud management platforms contribute client, radio, and access point telemetry. Packet and flow visibility can reveal whether the delay originates in wireless transport, the LAN, WAN, internet path, or an application service. A current Wi-Fi survey and design model provides the physical context that operational dashboards cannot: expected coverage, capacity assumptions, wall attenuation, AP placement, and channel plans.
The Metrics That Lead to Useful Decisions
No single metric defines wireless quality. Teams need to assess metrics in context, especially during periods and in locations where users report problems.
Signal strength and signal-to-noise ratio indicate whether a client has a viable RF link. RSSI is often the first value engineers check, but SNR frequently offers more diagnostic value because it accounts for the noise floor. Weak SNR can point to interference, environmental noise, or insufficient signal at the client location.
Channel utilization shows how much airtime is already consumed. High utilization may result from legitimate demand, co-channel contention, legacy low-rate clients, retransmissions, or non-Wi-Fi interference. The remedy depends on the cause. Deploying more APs can improve capacity in a carefully designed environment, but it can also worsen co-channel interference when cell sizes, channels, and transmit power are not planned together.
Retry rates, packet loss, and PHY rates help expose poor RF efficiency. A high retry rate means frames require retransmission, consuming airtime that could serve other clients. Low PHY rates may be appropriate for a distant or low-capability device, but widespread low rates usually require investigation of coverage, channel conditions, client drivers, or minimum data-rate settings.
Client association and roaming data show whether devices connect to the intended AP and band, remain attached to distant APs, or fail during transitions. This is particularly relevant for voice, clinical mobility, barcode scanning, and other use cases where a brief disruption can affect operations. Authentication times, DHCP response times, and DNS performance should also be included. These services are often blamed on Wi-Fi because the failure becomes visible when a user joins the network.
Start With a Defined Business Question
Analytics produces the best results when it is tied to an operational question rather than treated as a collection exercise. “Why are users in Building B reporting slow access between 9:00 and 11:00 a.m.?” is a stronger starting point than “What does the WLAN dashboard show?” It establishes the affected site, time window, user population, and expected service level.
For a warehouse, the question may focus on handheld devices losing connectivity along a picking route. For a university, it may concern high-density lecture halls during class changes. For a healthcare organization, it may involve whether roaming performance supports mobile clinical applications. Each scenario requires different thresholds, validation methods, and priorities.
This approach also prevents a common error: treating averages as proof of quality. Average signal strength or average channel utilization can hide short, disruptive events. Analytics should support filtering by site, floor, SSID, client type, AP, radio, time range, and application where possible. A five-minute spike in retries during a critical shift can matter more than a favorable daily average.
A Practical WiFi Analytics Workflow
A disciplined workflow turns raw telemetry into repeatable improvement. Begin by establishing a baseline after the network has been designed, validated, and placed into service. Record normal client volumes, typical channel utilization, expected throughput, roaming behavior, and the performance of critical applications. Without a baseline, teams may know that a number is high or low but not whether it is unusual for that environment.
When an issue occurs, correlate the user report with the client journey. Confirm the client identity, its AP and radio association, the time of the event, roaming history, signal and noise conditions, retry behavior, and IP service activity. Then check the path beyond the wireless edge. If the RF link is healthy but DNS requests or application transactions are delayed, the root cause may sit elsewhere in the infrastructure.
Next, compare the event against other clients. A problem affecting one device type may indicate a driver, operating system, supplicant, or hardware issue. A problem affecting all clients on one AP may point to the AP, switch port, cabling, PoE budget, or uplink. A condition appearing across a floor may indicate channel contention, an RF change, or a capacity shortfall. This comparison keeps troubleshooting from becoming guesswork.
Finally, validate the corrective action. If you change AP power, channel assignments, minimum data rates, or roaming settings, measure the outcome during comparable demand. For physical changes, use a post-change survey to confirm that the intended coverage and capacity objectives were achieved. Operational analytics and survey validation serve different purposes, but together they provide a more dependable basis for change control.
Analytics Is Not a Substitute for RF Design
Cloud-managed WLAN platforms provide extensive telemetry, yet they cannot fully replace planning and validation. Analytics can show that clients have weak signal in a room. A predictive design and on-site survey can show how construction materials, AP locations, antenna patterns, and neighboring cells contribute to that condition.
The same principle applies to capacity. High channel utilization may suggest that more capacity is needed, but the appropriate answer could be a new channel plan, a redesign for 6 GHz, revised AP placement, client modernization, or an adjustment to application behavior. It depends on the spectrum available, device support, density pattern, and operational requirements.
Organizations should also consider data retention, privacy, and scale. Retaining detailed client telemetry for longer periods supports trend analysis and incident investigation, but it increases storage requirements and requires clear governance. Location analytics can be valuable for space planning and operations, yet teams should define who can access that data and how it is handled. The goal is sufficient visibility for accountable operations, not indiscriminate data collection.
Extending Visibility Beyond the Wireless Edge
The most costly incidents are often cross-domain problems. A user sees a slow wireless application, while the actual issue is a saturated switch uplink, an intermittent copper link, a WAN policy, or a server-side delay. Wireless telemetry identifies the user impact; packet, flow, and infrastructure visibility help isolate the responsible domain.
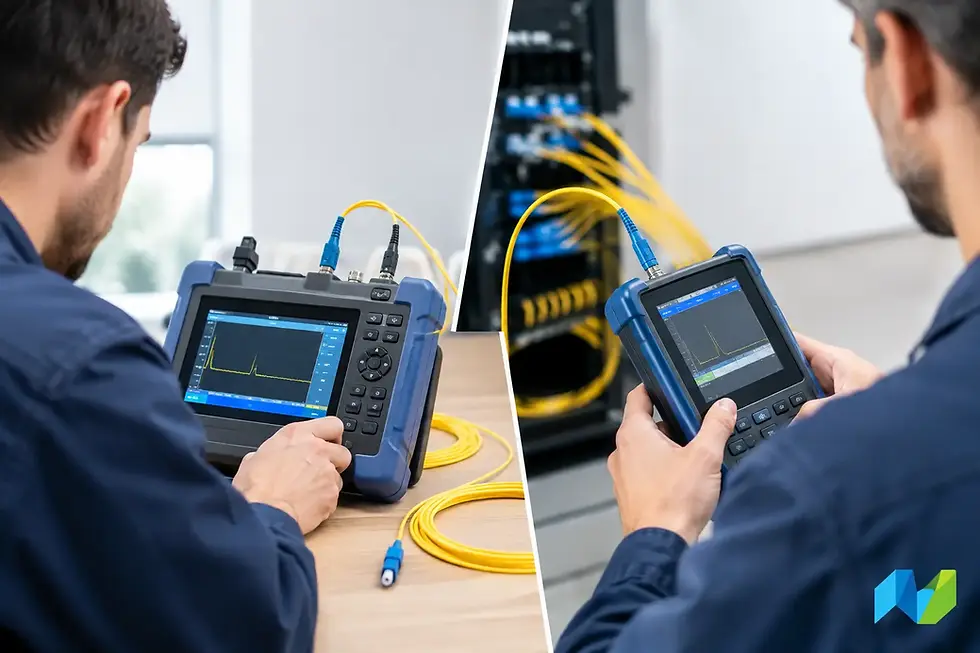
This is where a layered tool strategy is valuable. Wi-Fi survey and design platforms support planning and validation. WLAN management systems provide operational telemetry and alerting. Network performance and packet analysis tools establish path-level evidence. Copper, fiber, and PoE testing tools confirm that the physical infrastructure can support the wireless design. Each category answers a different question, and gaps between them often extend time to resolution.
For technical leaders, the purchasing decision should therefore focus on workflow fit, not feature count alone. Consider whether the platform can retain useful history, correlate client and infrastructure data, support distributed sites, integrate with existing operations, and produce evidence that engineering teams can act on. Responsive technical guidance also matters when building processes around specialized tools.
Turn Evidence Into Better Wireless Operations
The value of WiFi analytics is not the number of charts available to the network team. Its value is the ability to prioritize work based on user impact, verify design assumptions, reduce recurring incidents, and make infrastructure investments with defensible evidence.
A mature program combines well-designed wireless infrastructure with continuous operational visibility and periodic validation. Advanced Network Devices Inc. helps organizations align those capabilities with their environment, whether the immediate need is Wi-Fi design, network visibility, packet analysis, or physical-layer testing. The practical next step is to identify one recurring wireless complaint, define the evidence needed to explain it, and build the measurement process around that outcome.


Comments