

Which Network Metrics Matter for Business?
A network can show every interface as up while users struggle with choppy voice calls, slow cloud applications, roaming failures, or intermittent access to critical systems. That is why asking which network metrics matter is more useful than simply asking whether the network is online. The right measurements connect infrastructure behavior to user experience, application delivery, and operational risk.
For IT teams responsible for complex wired and wireless environments, the objective is not to collect the largest possible volume of telemetry. It is to establish a focused baseline, detect meaningful deviations, and have enough evidence to isolate the cause before business operations are affected. The metrics that deserve attention depend on the environment, but a practical monitoring strategy consistently starts with availability, performance, capacity, and quality.
Which Network Metrics Matter Most?
The most valuable metrics are those that answer a specific operational question. Is a site reachable? Is an application path slow? Is the Wi-Fi network delivering a usable experience? Is a switch, circuit, or access point approaching a limit? A metric without context can be misleading, especially when teams are monitoring hundreds of devices and thousands of clients.
Start by measuring at more than one layer. Device health alone will not reveal an application delivery issue, and a clean Wi-Fi signal reading does not prove that a client can reach a cloud service efficiently. Combining infrastructure monitoring, flow visibility, packet analysis, and physical-layer testing provides a more dependable picture of what users actually experience.
Availability and reachability
Availability is foundational, but it should not be reduced to a simple ping result. ICMP reachability can confirm that an address responds, yet it does not prove that DNS, authentication, routing, application services, or internet access are working as intended.
Track device uptime, interface operational state, service availability, and route stability. For business-critical systems, use synthetic checks that validate the actual transaction where practical, such as reaching a key application endpoint or completing a DNS lookup. This helps separate a device outage from a service outage.
Availability metrics are particularly useful for identifying recurring site, provider, or hardware problems. However, a 99.9% availability figure can still hide disruptive short events. Pair uptime reporting with event duration, incident frequency, and business impact to avoid false reassurance.
Latency, jitter, and packet loss
Latency, jitter, and packet loss are central to user experience, especially for real-time communications, virtual desktops, cloud applications, and distributed business systems. They should be measured across the actual path that matters: client to gateway, branch to data center, site to cloud application, or voice endpoint to call platform.
Latency is the time required for traffic to travel between points. A higher value is not automatically a fault, since geographic distance and application architecture affect expected response times. What matters is whether latency has moved outside the normal baseline or is excessive for the workload.
Jitter measures variation in packet arrival time. A voice call may tolerate moderate latency better than inconsistent latency. Packet loss is equally significant because retransmissions can reduce throughput and make applications feel slow even when a speed test looks acceptable. For voice and video traffic, loss and jitter deserve close attention because users notice their effects immediately.
When these metrics worsen, avoid assuming the WAN circuit is at fault. Queue congestion, overloaded firewalls, wireless retransmissions, routing changes, and cloud provider paths can all contribute. Flow data and packet-level visibility are often needed to determine where the degradation begins.
Utilization, capacity, and congestion
Bandwidth utilization is one of the most common network measurements and one of the easiest to misinterpret. A circuit running at 60% average utilization may still experience brief 100% bursts that affect interactive traffic. Conversely, consistently low utilization does not eliminate congestion if an interface has duplex errors, microbursts, or poor queue management.
Monitor inbound and outbound utilization at WAN links, core uplinks, switch trunks, firewall interfaces, and wireless backhaul connections. Look for sustained patterns by time of day, not just peak values. Capacity planning becomes more reliable when utilization is paired with application and traffic-class information.
The key questions are straightforward: what traffic is consuming capacity, when does it occur, and is it business-critical? Network flow monitoring can identify top talkers, protocols, destinations, and conversations. That evidence supports decisions about circuit upgrades, QoS policy, segmentation, or application scheduling instead of relying on assumptions.
Interface health and error rates
Interface errors can create problems that resemble application or performance failures. CRC errors, discards, input errors, output drops, collisions on legacy links, and link flaps are useful indicators of physical faults, configuration mismatches, or congestion.
Error counters should be reviewed as rates and trends, not only as cumulative totals. A switch port with a large lifetime error count may have been corrected months ago. A small but rapidly increasing CRC count is more urgent. Link flaps also deserve investigation, particularly on uplinks, access point connections, and fiber runs supporting critical services.
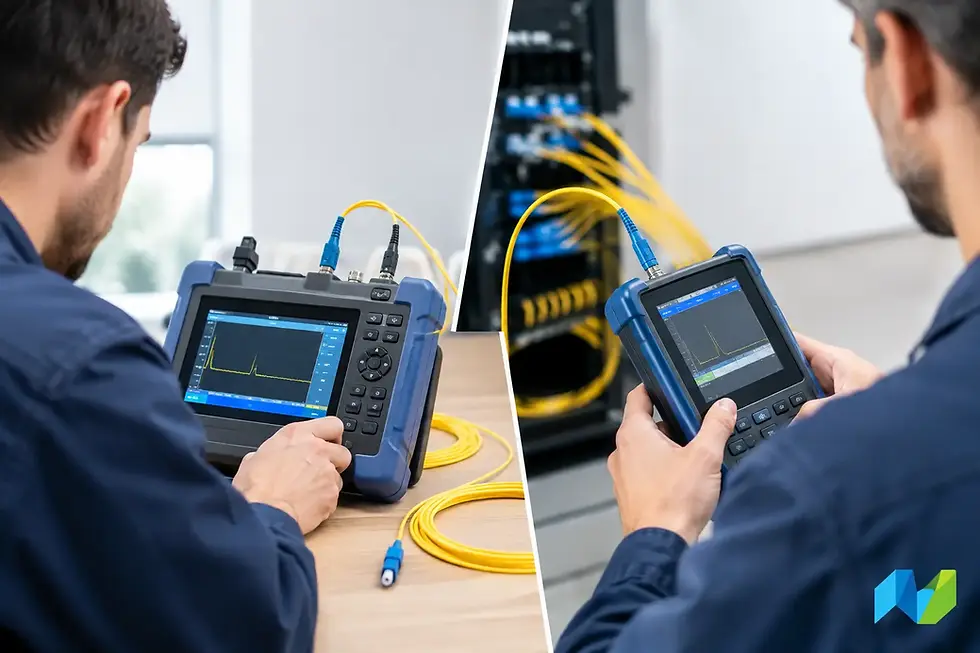
Physical-layer validation is essential when error patterns point below the network stack. Certified copper and fiber testing can confirm whether a cabling system meets requirements and can prevent teams from spending hours troubleshooting configuration or software symptoms caused by an installation issue.
Wireless Metrics That Reflect Client Experience
Wireless networks require their own performance model. An access point can be reachable and lightly utilized while clients experience weak coverage, high retransmissions, poor roaming, or excessive contention. Wi-Fi monitoring should combine controller telemetry with survey, design, and validation data.
Four wireless measurements are particularly useful when interpreted together:
Signal strength and signal-to-noise ratio indicate whether clients have enough usable RF energy for their location and application needs.
Channel utilization shows how busy the RF medium is, including contention that may not appear in wired interface statistics.
Retry and retransmission rates reveal airtime waste caused by interference, weak clients, collisions, or poor RF design.
Roaming performance shows whether mobile devices move between access points without disruptive delays or authentication failures.
Client count alone is not a reliable capacity metric. Ten low-bandwidth scanners and ten video conferencing users create very different airtime demands. Likewise, 5 GHz and 6 GHz availability, channel width, client capabilities, and nearby RF conditions can change the meaning of the same utilization value.
A predictive design is a strong starting point, but validation after deployment is where assumptions meet the physical environment. Site surveys and post-installation verification help confirm coverage, capacity, roaming behavior, and interference conditions in the locations where people work.
Application response and traffic visibility
Infrastructure metrics tell teams what the network is doing. Application-aware metrics help determine whether that activity affects the services the business relies on. Monitor response time, transaction failures, DNS performance, connection setup time, and server-side versus network-side delay where visibility allows.
This distinction matters during troubleshooting. If users report that an ERP platform is slow, high latency on a WAN path is relevant, but so are application server response time, database delays, TLS negotiation, and packet retransmissions. Packet capture and network forensics can provide the evidence needed to avoid sending the issue to the wrong team.
Traffic visibility also strengthens security and governance. Unexpected encrypted traffic volumes, new external destinations, unusual east-west activity, or sudden growth in a protocol can signal a performance issue, a configuration change, or a security concern. The goal is not to inspect every packet indefinitely. It is to retain the right visibility for critical paths and investigate deviations with confidence.
Build a Baseline Before Setting Thresholds
Static thresholds are useful for urgent conditions, such as an interface down or a failed service check. They are less reliable for performance metrics that vary by site, time, application mix, and business cycle. A branch office may normally have high utilization during a nightly backup window. A hospital, warehouse, or campus may have predictable wireless peaks tied to shift changes or class schedules.
Establish normal behavior over a representative period, then set alerting around meaningful deviations. Correlate events across layers. A rising WAN utilization alarm has more value when it coincides with packet loss, increased application response time, and a flow record showing a new backup workload. This reduces alert noise and accelerates root-cause analysis.
Metric ownership also matters. Define who responds to circuit issues, wireless experience problems, cabling faults, security anomalies, and application performance incidents. Clear escalation paths turn monitoring data into action rather than another dashboard that receives attention only after an outage.
Advanced Network Devices Inc. helps organizations align monitoring, Wi-Fi validation, testing, and network visibility tools with the requirements of their environment. The most effective strategy is not the one with the most metrics. It is the one that gives your team timely, credible answers when a user says, “The network is slow.”


Comments